1. Data overview
Petr V. Nazarov, LIH
2025-02-10
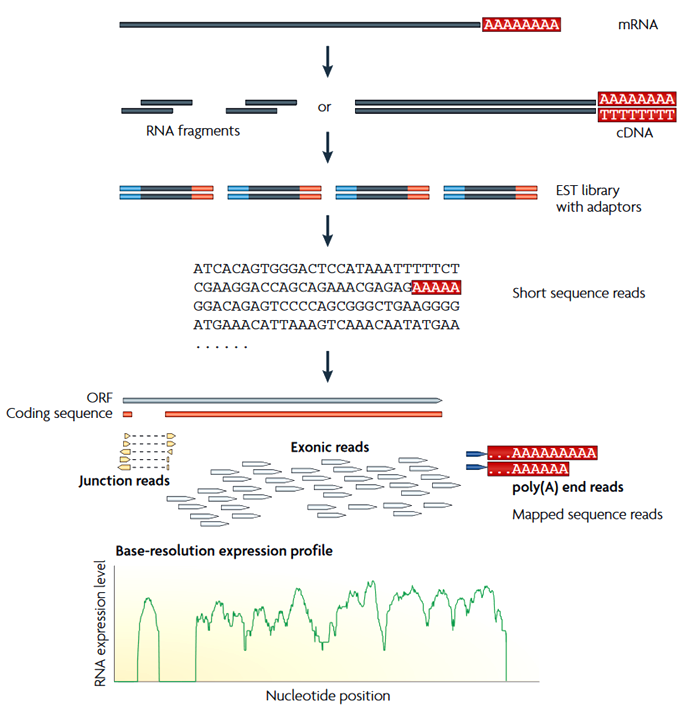
1.1. RNA-seq Data Generation
Short dictionary:
- read: short fragment detected by RNA-seq
- library: collection of all reads from the sample
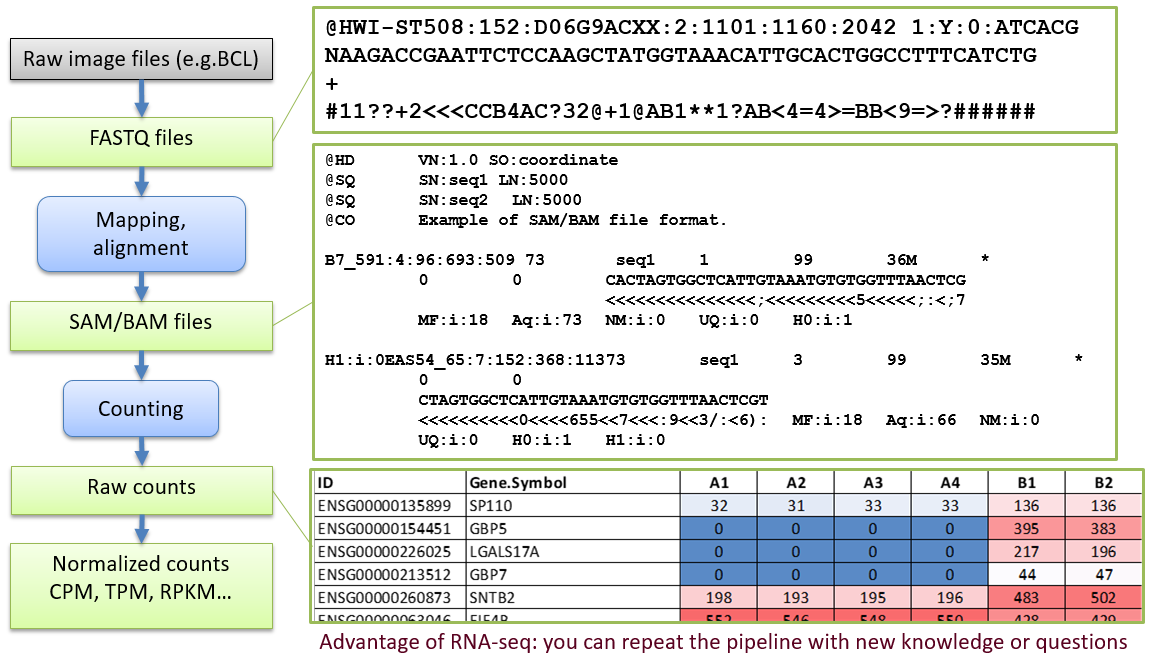
- counts: raw counts - number of fragment from a gene in a sample
- CPM: counts per million nucleotides
- TPM: transcripts per million (proportion)
- FPKM: fragments per kilobase of exon per million reads mapped
- RPKM: reads per kilobase of exon per million reads mapped. (for single-end)
\[ CPM_i = \frac{X_i}{\frac{N}{10^6}} = \frac{X_i}{N}10^6 \] \[ FPKM_i = \frac{X_i}{\frac{l_i}{10^3} \frac{N}{10^6}} = \frac{X_i}{l_i N}\cdot 10^9 \]
\[ TPM_i = \frac{X_i}{l_i} \frac{10^6}{\sum_j{\frac{X_j}{l_j}}} \] \(X_i\) – observed number of counts (reads)
\(N\) – number of reads in a sample (library size)
\(l_i\) – length of the gene or transcript
10-minute simple explanation of TPM / FPKM is here.
1.2. File Formats
Phred quality is defined as \(Q = -10 log_{10}{P}\), where P - base-calling error
1.3. Sequence-based QC
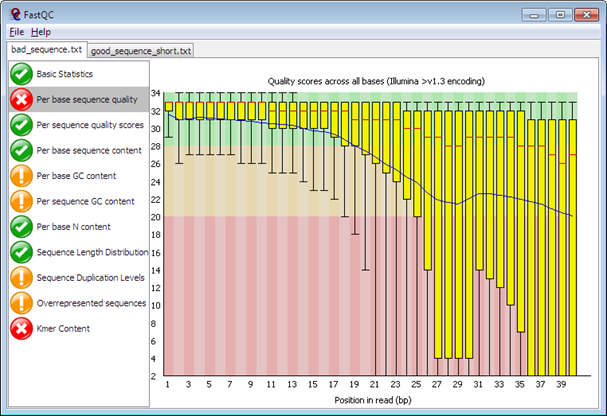
FastQC – a simple but widely-used Java-based tool for quality control of the experiments at the sequence level. It provides a modular set of analyses which you can use to give a quick impression of whether your data has any problems of which you should be aware before doing any further analysis.
See Examples.
Import of data from BAM, SAM or FastQ files (any variant)
Providing a quick overview to tell you in which areas there may be problems
Summary graphs and tables to quickly assess your data
Export of results to an HTML based permanent report
Offline operation to allow automated generation of reports without running the interactive application
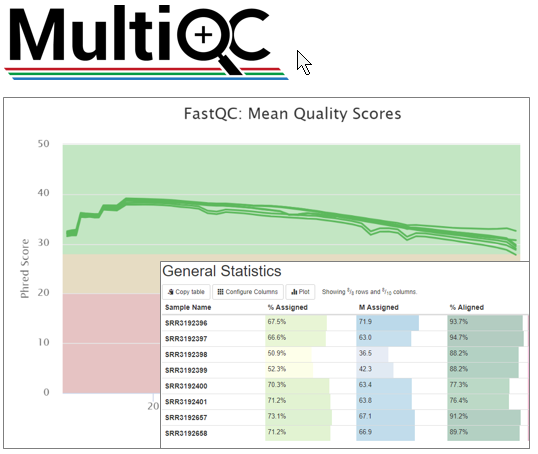
You can combine FastQC results into an interactive dashboard usin MultiQC. Short introduction in this video.
1.4. Statistical Properties
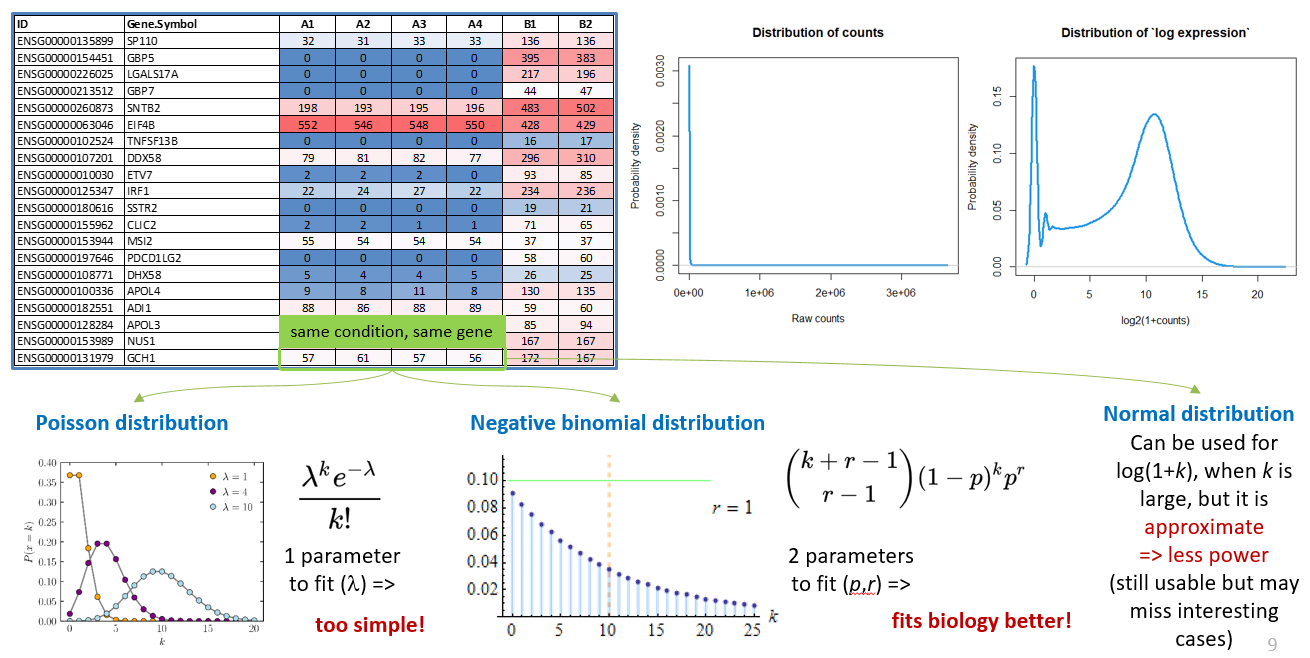
Raw counts (same as CPM, FPKM, TPM) - strongly right-skewed. Any vizualization, e.g. PCA, needs log transformation. Simplest option: \(g_i = log_2{(1+x_i)}\)
Raw counts are usually is approximated by negative-binomial (NB) random variables, with 2 parameters estimated from the experiment.
CPM, TPM, FPKM do not follow NB distribution - may require log transformation, corrections, and using statistics based on normal distribution.
1.5. Data Repositories
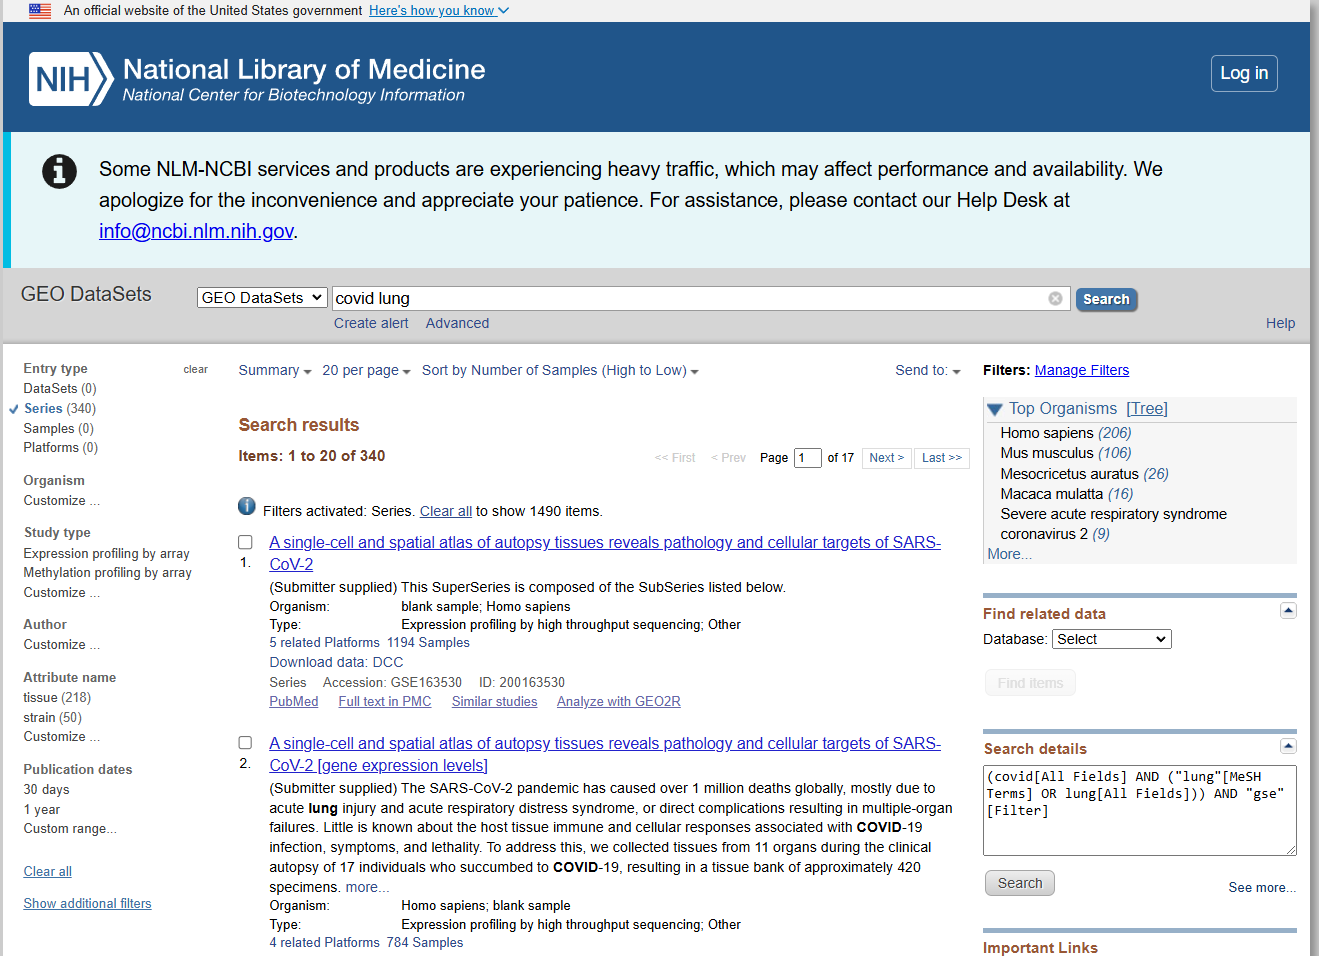
- GEO - largest repository with free omics data (mainly transcriptomics) by NCBI
ArrayExpress - EU-based analogue of GEO.
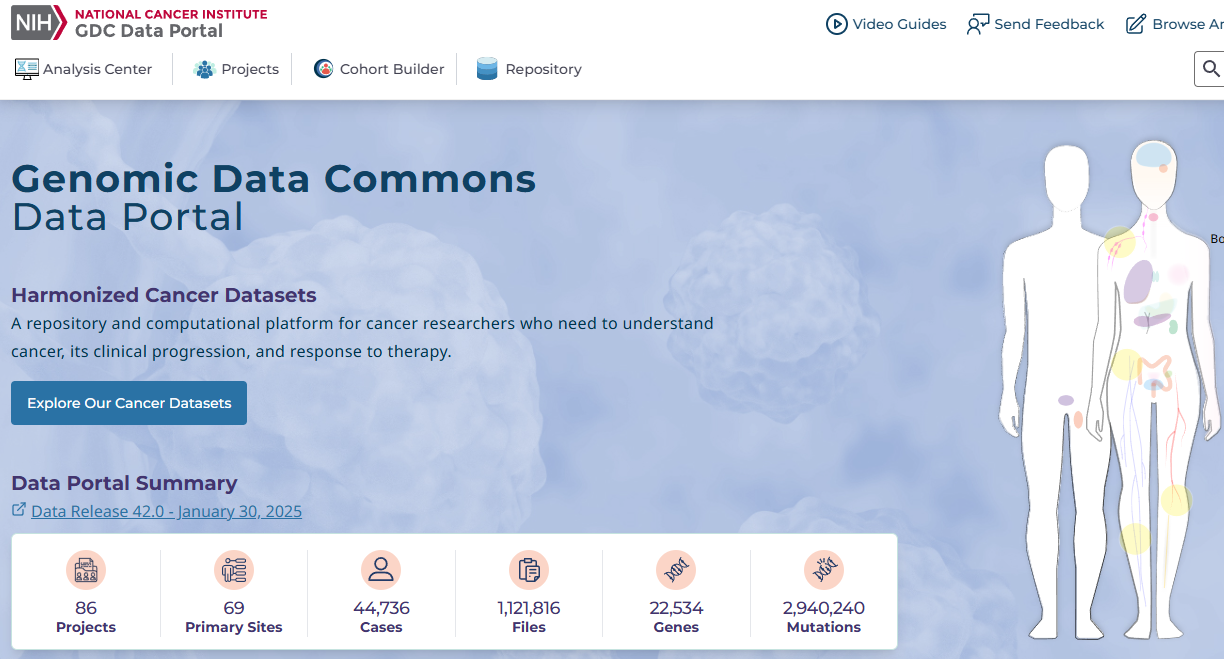
TCGA - ~ 11k cancer samples studied by various omics techniques.
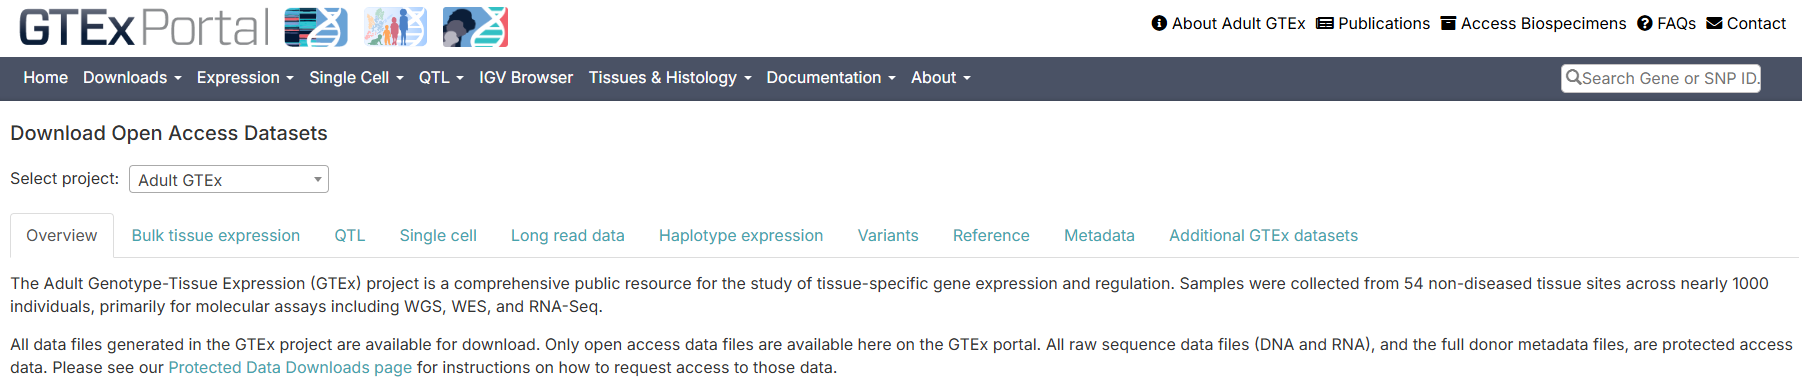
- GTEx - ~ 17k normal (post mortem) samples studied by RNA-seq.
Take home messages
- RNA-seq can be used as row counts and normalized (TPM, FPKM). See what you need for a specific algorithm!
- For QC of your samples at sequence level – use FastQC. To combine results - MultiQC
- Expression-related data in transcriptomics are strongly right-skewed. Therefore:
for statistics use either precise distribution (negative binomial for RNA-seq) or work with log-transformed data
use log-transformed data for exploratory analysis and visualization
- Several large repositories of the data exist. Before planning your experiments – make a search for existing data
| Home Next |
By Petr Nazarov
|