4. Methods for RNA-seq data
Petr V. Nazarov, LIH
2023-10-24
4.1. Linear models for transcriptomics data
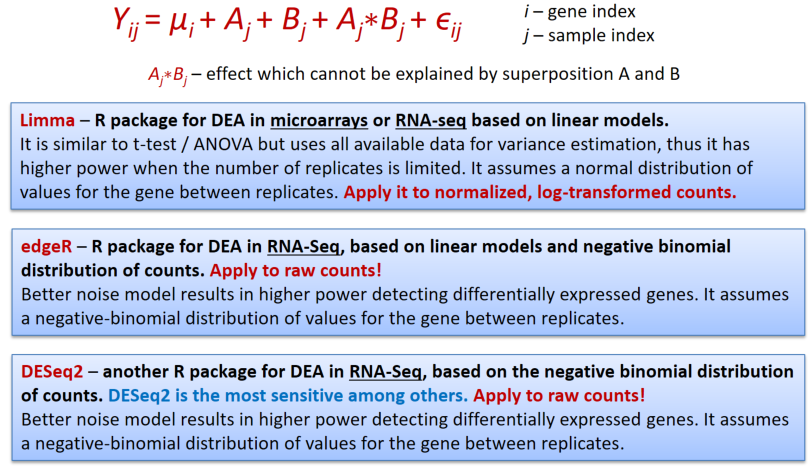
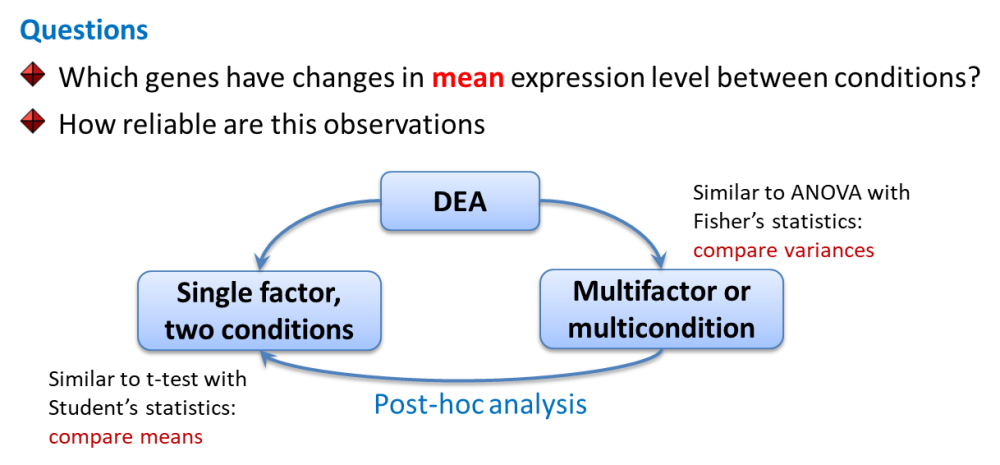
In genomics we will speak about differential expression analysis (DEA), when we would like to compare mean expression of genes between 2 or more sample groups.
4.2. Differential Expression Analysis
4.2.1. DEA: Preparing for limma, edgeR, DESeq
In the native R, the vast majority of the libraries (or packages) can
be simply installed by install.libraries("library_name").
However, some advanced R/Bioconductor packages may need advanced
handling of the dependencies. Thus, we would recommend using
BiocManager::install() function:
if (!requireNamespace("BiocManager", quietly = TRUE))
    install.packages("BiocManager")

BiocManager::install("limma")
BiocManager::install("edgeR")
BiocManager::install("DESeq2")

## if you wish, you can also use my simple warp-up
source("http://r.modas.lu/LibDEA.r")
#DEA.limma
#DEA.edgeR
#DEA.DESeq
More detailed tutorials you could find on external resources, e.g.:
DESeq, or more correctly DESeq2,
(developed in EMBL, Heidelberg) is a very powerful package, but also the
most demanding one in terms of dependencies :)…
Please try to install all 3 packages.
Limma works similar to ANOVA with somewhat improved post-hoc analysis and p-value calculation (empirical Bayes statistics).
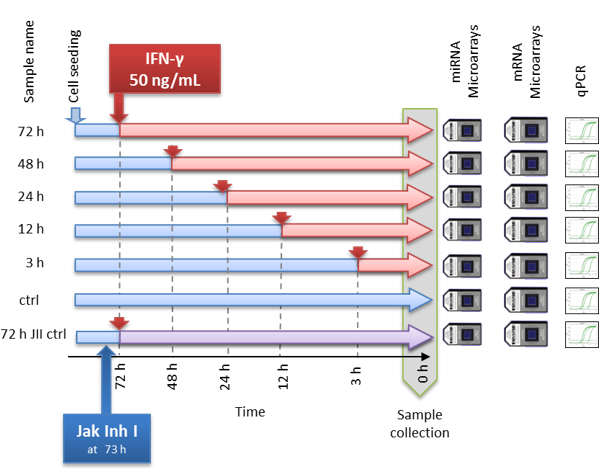
4.2.2. DEA: Example of a time-course experiment
Let’s consider an example - a time course experiment from this paper.
This specific example is based on the microarray data, but all points
discussed below you can apply after to sequencing data using
corresponding warp-up: DEA.limma(...,counted=TRUE),
DEA.edgeR(...), DEA.DESeq(...).
Load the data from the following format
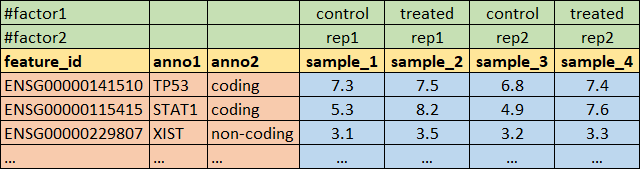
## load the data that are in annotated text format
source("http://r.modas.lu/readAMD.r")
mRNA = readAMD("http://edu.modas.lu/data/txt/mrna_ifng.amd.txt",
      stringsAsFactors=TRUE,
          index.column="GeneSymbol",
          sum.func="mean")
str(mRNA)
library(pheatmap)
## load custom functions
source("http://r.modas.lu/LibDEA.r")## [1] "----------------------------------------------------------------"
## [1] "libDEA: Differential expression analysis"
## [1] "Needed:"
## [1] "limma" "edgeR" "DESeq2" "caTools" "compiler" "sva"
## [1] "Absent:"
## character(0)## DEA: the most variable genes (by F-statistics)
ResF = DEA.limma(data = mRNA$X, group = mRNA$meta$time)## [1] "T03-T00" "T12-T00" "T12-T03" "T24-T00" "T24-T03" "T24-T12"
## [7] "T48-T00" "T48-T03" "T48-T12" "T48-T24" "T72-T00" "T72-T03"
## [13] "T72-T12" "T72-T24" "T72-T48" "T72J-T00" "T72J-T03" "T72J-T12"
## [19] "T72J-T24" "T72J-T48" "T72J-T72"
##
## Limma,unpaired: 11468,9604,7444,5630 DEG (FDR<0.05, 1e-2, 1e-3, 1e-4)genes = order(ResF$FDR)[1:100] ## select top 100 genes
pheatmap(mRNA$X[genes,],cluster_col=FALSE,scale="row",
fontsize_row=2, fontsize_col=10, cellwidth=15,
main="Top 100 significant genes (F-stat)")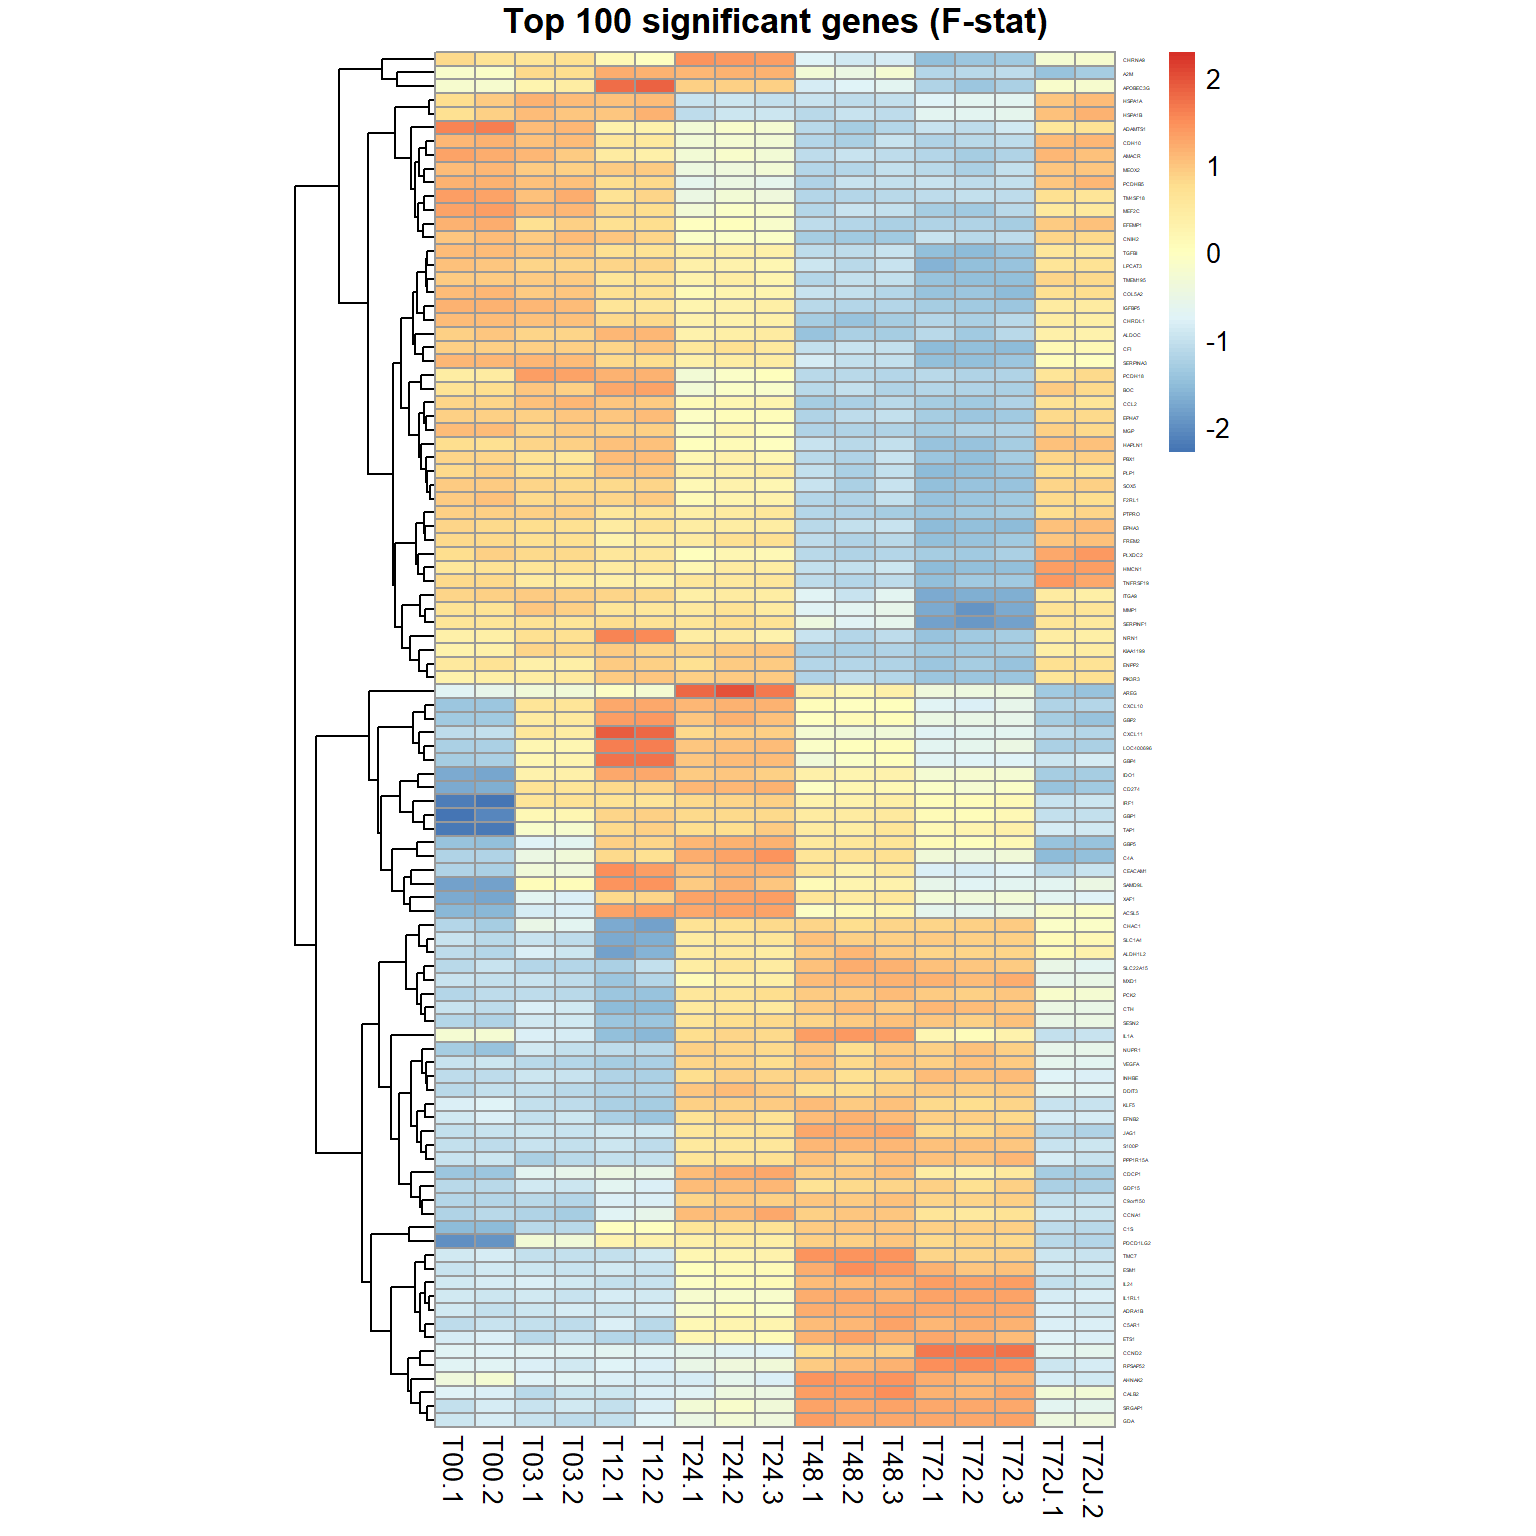
## DEA: genes differentially expressed (by moderated t-test)
Res24 = DEA.limma(data = mRNA$X,
                  group = mRNA$meta$time,
                  key0="T00",key1="T24")
##
## Limma,unpaired: 5895,3980,2146,1023 DEG (FDR<0.05, 1e-2, 1e-3, 1e-4)## volcano plot
plotVolcano(Res24,thr.fdr=0.01,thr.lfc=1)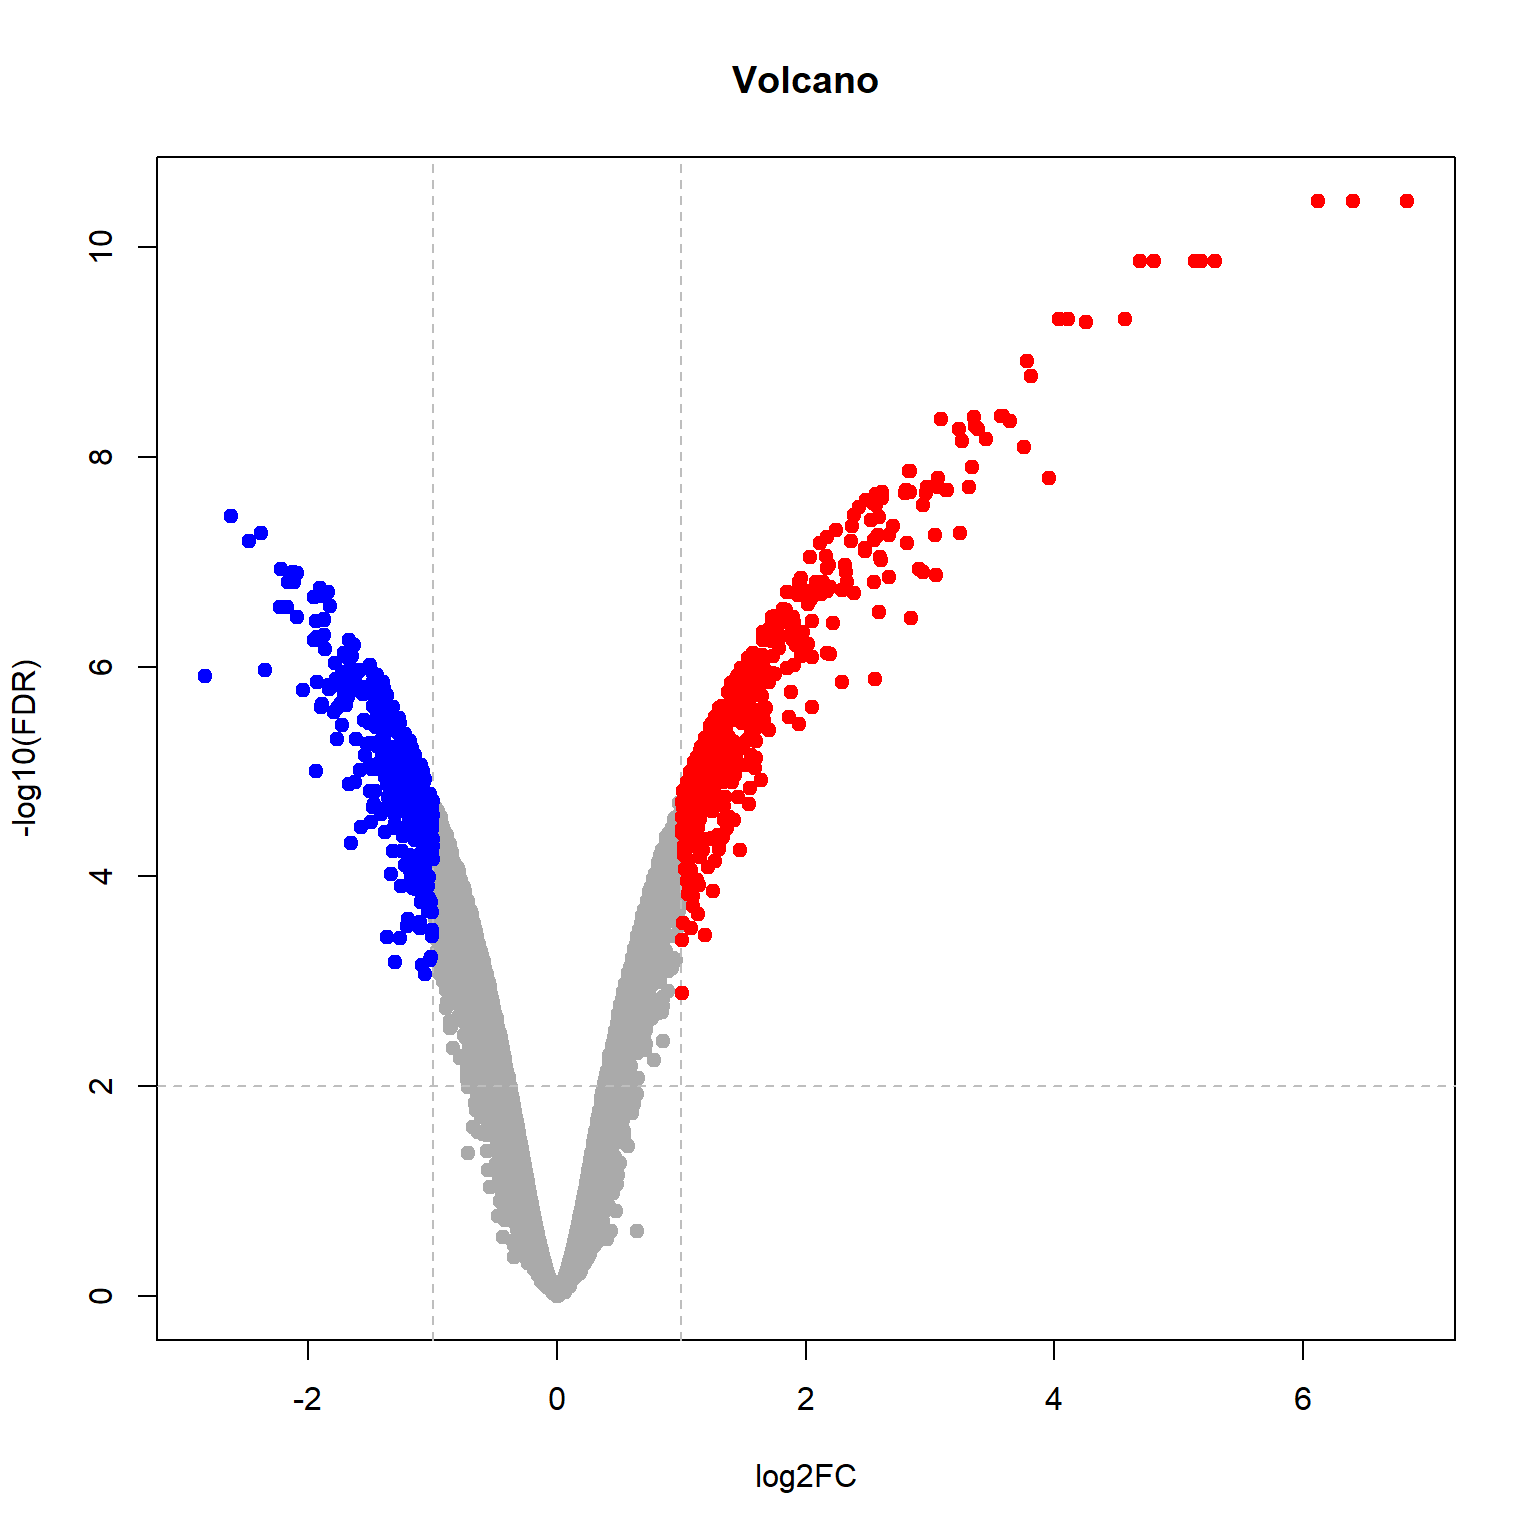
genes = order(Res24$FDR)[1:100]  ## select top 100 genes
samples = grep("T00|T24",mRNA$meta$time) ## select T00,T24 sampl.
pheatmap(mRNA$X[genes,samples],cluster_col=FALSE,scale="row",
  fontsize_row=2, fontsize_col=10, cellwidth=15,
  main="Top 100 significant genes T24-T00 (moderated t-stat)")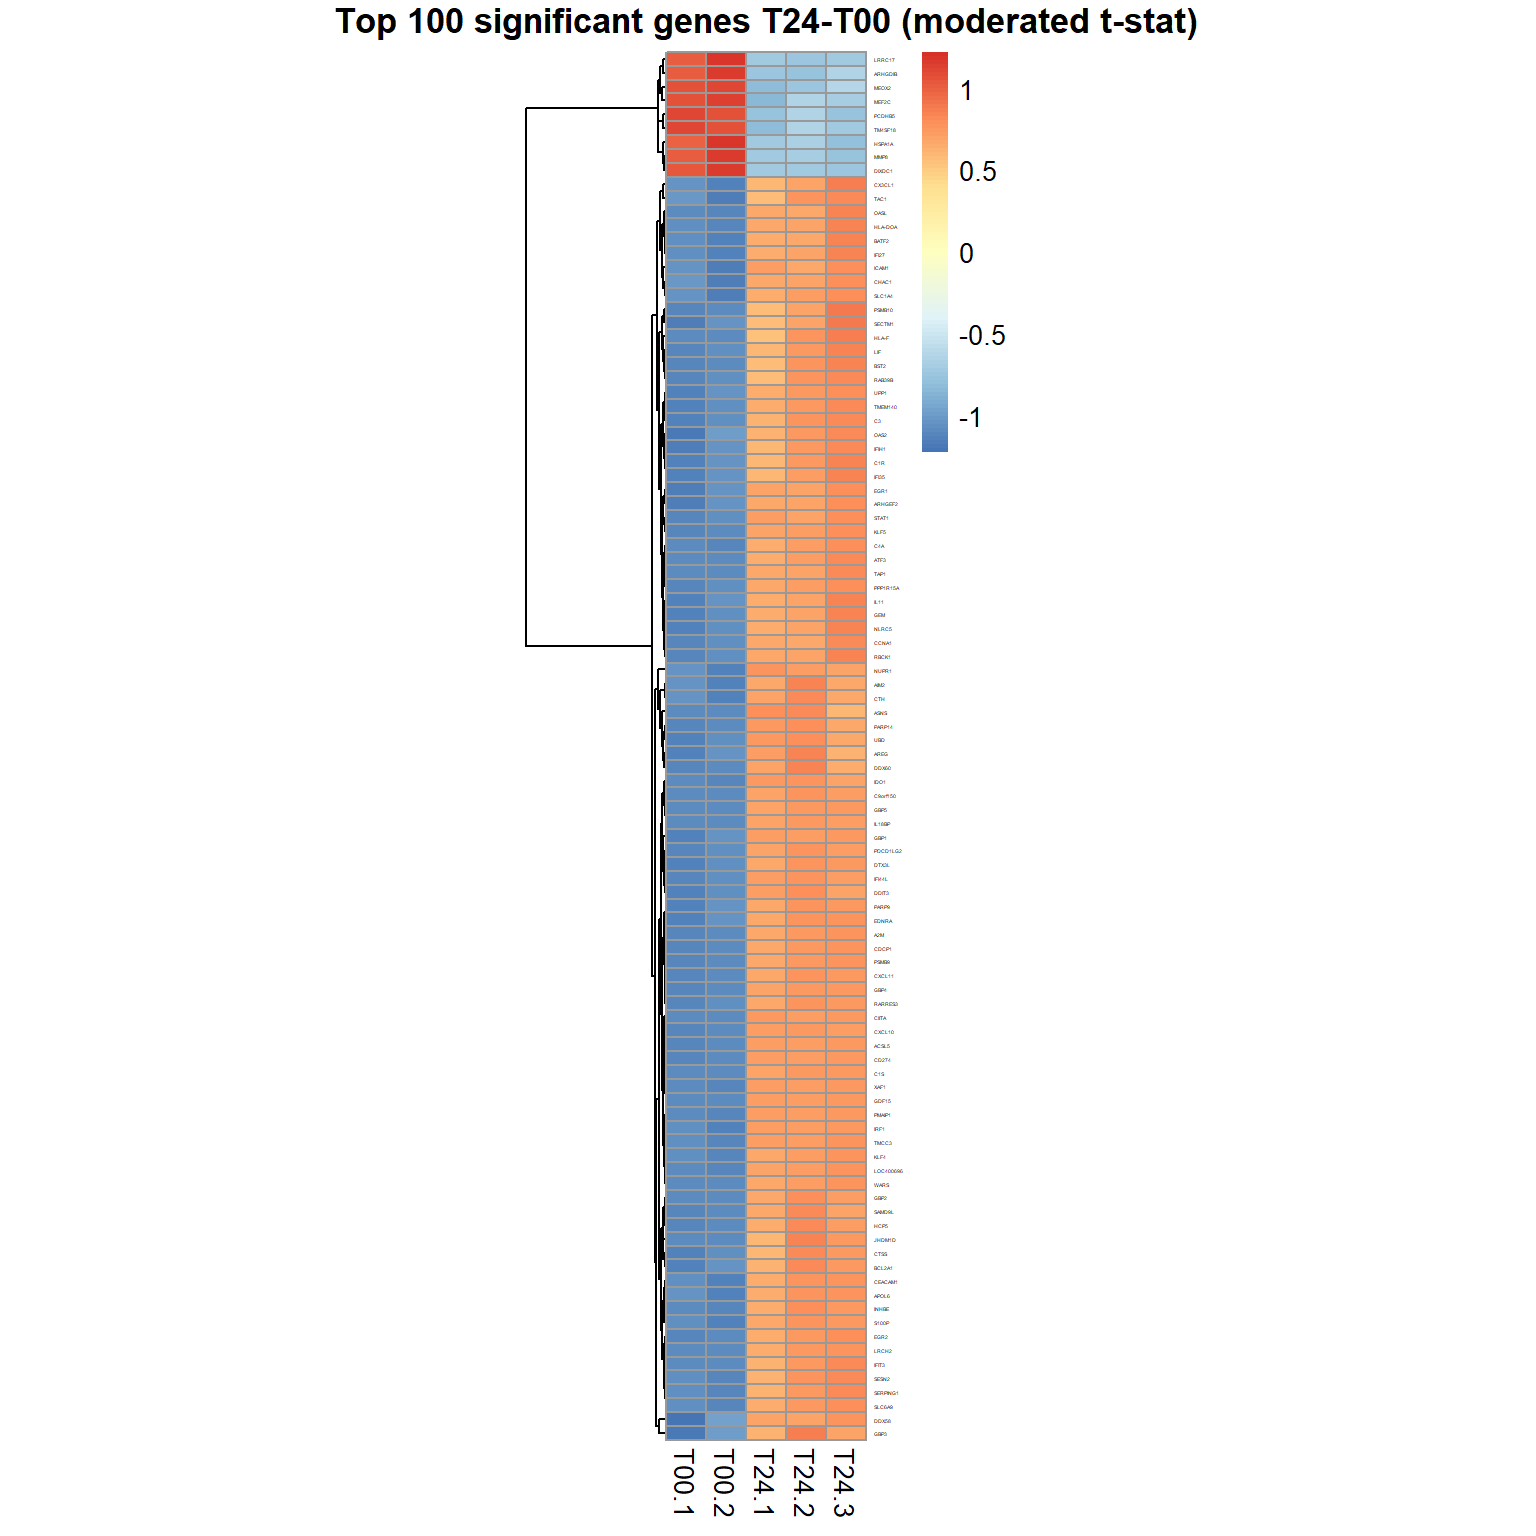
Let’s save the results - we will use the after for function annotation.
## save the most variable genes (by F-statistics)
write.table(ResF[ResF$FDR<0.0001,],file = "DEA_F.txt",
            col.names=NA, sep="\t", quote=FALSE)

## save significant genes T24-vs-T00
write.table(Res24[Res24$FDR<0.001 & abs(Res24$logFC)>1,],
            file = "DEA_T24-T00.txt",
            col.names=NA, sep="\t", quote=FALSE)
## save gene list (response at 24 h of IFNg treatment)
write(Res24[Res24$FDR<0.0001,1],file="genes24.txt")
Please, investigate the results. Submit any list to the functional annotation tool Enrichr
Other tools to be considered:
Take home messages 4
- If you are looking at a multi-factor / multi-treatment experiment, you may check the variable genes (F-statistics based) first, and then go for the contrasts.
- To find the biological meaning of the significantly regulated genes, please use enrichment analysis methods linking known functional groups of genes to DEA results.
- Enriched categories are usually more robust than individual genes. If you have no significant genes – check gene sets by GSEA.
| Prev Home |
By Petr Nazarov
|